


Revolutionize your coaching, mentoring and performance reporting with real-time insights and dynamic KPI tracking
Explore KPIConnect—the all-in-one solution for real-time KPI management. It helps to instantly update KPIs, stay connected with teams, and boost alignment, performance, and accountability across the organization.
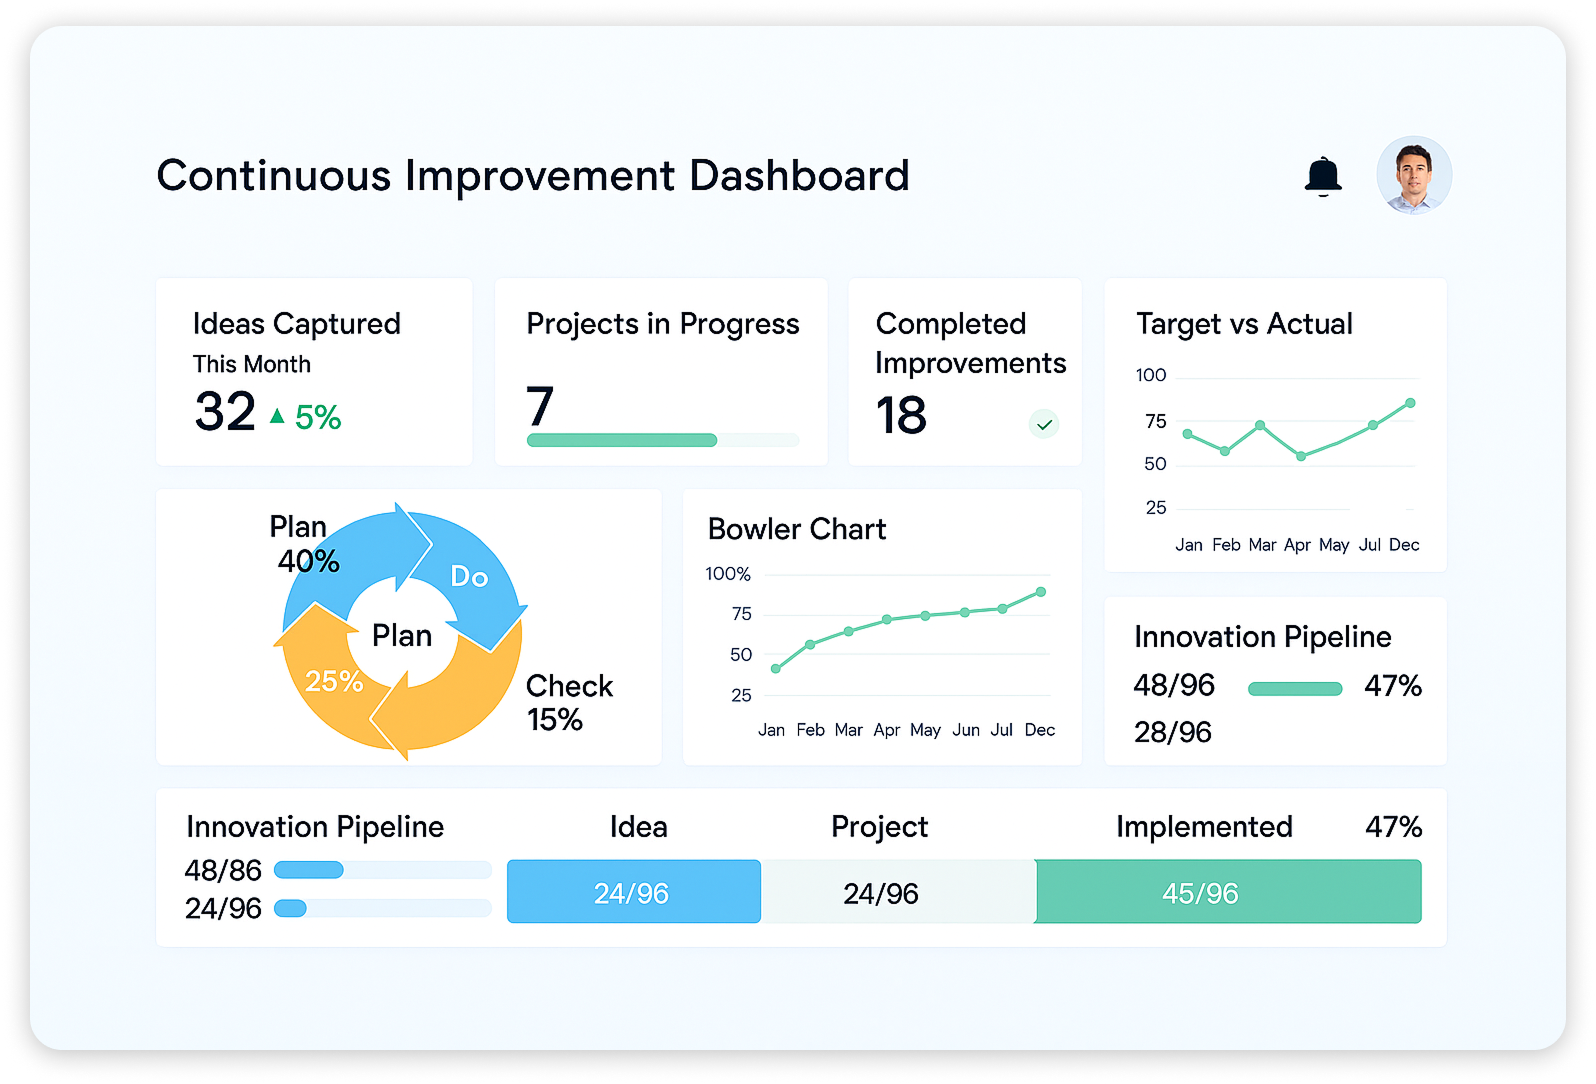
The Bowler Chart reporting help transform KPI tracking. It can enhance daily, weekly, and monthly performance reviews-providing real-time insights to boost operational excellence.
The Bowler Chart gives leaders a clear, visual overview of daily, weekly, and monthly KPIs—making it easy to spot trends, compare to targets, and guide teams with timely, data-driven coaching and decisions. You can easily access, navigate, and maximize the full potential of this tool in your leadership journey.
Make sure your workforce spends time where its actually required. Get work done better and faster.
Based On 4000+ Review
This is just the start, explore how you can optimise your workflow and increase revenue.

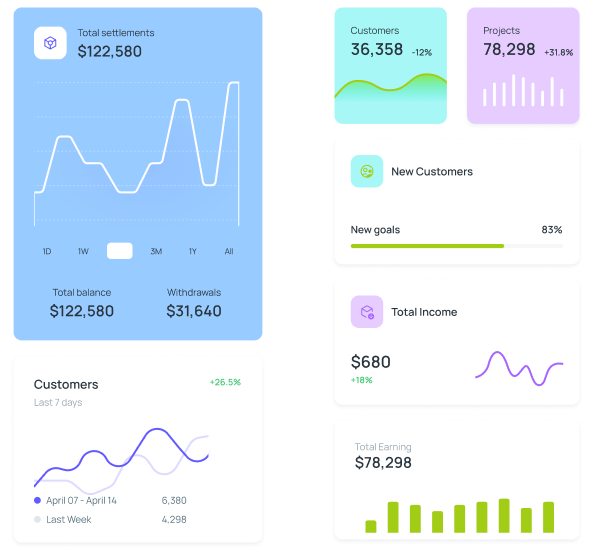
Monitor KPIs with real-time dashboards, bowler charts, and Pareto analysis.


Capture meeting notes and action items in one structured workspace.

Quickly capture, visualize, and export your team structure with role-based, auto-updating org charts.

Cascade and align goals with dynamic strategy and Hoshin X-Matrix tools.

Stop chasing for task & KPI status updates with a two-way feedback system.